Label the Diagram
← MotionTap a word, then tap its numbered spot on the picture. You can also choose words in the numbered list.
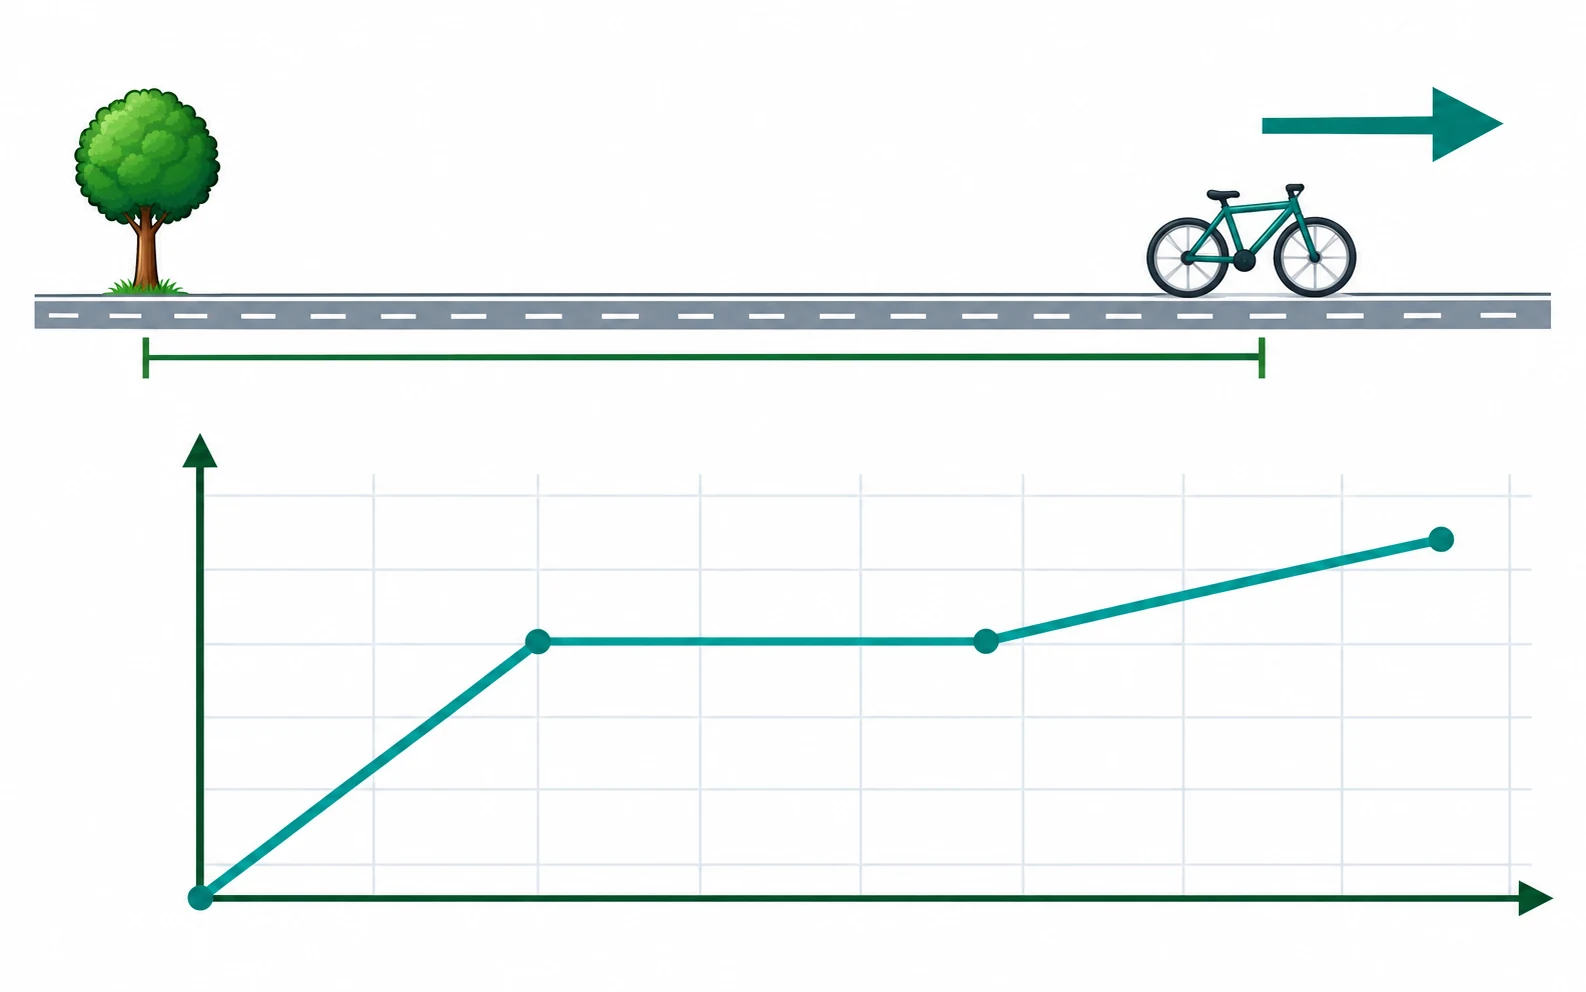
About this model: An invented journey, not measured class data. The vertical axis shows position relative to the tree; the horizontal axis shows elapsed time. A horizontal segment means no change in position. Steeper rising segments represent greater speed in the same direction.
 Original PotentELL science illustration
Word bank (7)
Numbered spots
- 1
- 2
- 3
- 4
- 5
- 6
- 7